Statistics
Statistics refers to a mathematical concept of interpretation and presentation of data. Statistics are used to make decisions and predict what may happen in the future.
« Previous Next »Presentation
Data can be presented visually in different ways, depending on the nature of the data and what you would like to show.
Pie Chart
are circular diagrams in which the angles of sectors represent the frequency (the angles are proportional to the frequency).
how to solve Statistics Pie chart
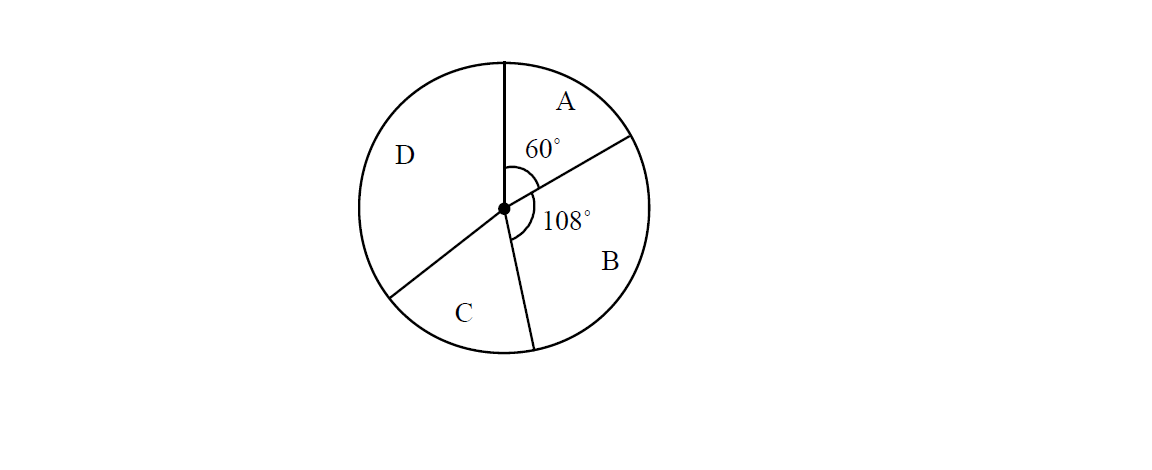
The pie chart represents 60 pupils
(a) What angle represents 1 person?
(b) How many people are represented by sector B?
(c) If sector C represents 9 people, find its angle.
(d) How many people does sector D represent?
Solutions
(a)
360˚ represents 60 people.
= 6˚ represent 1 person
(b)
= 18 people
(c)
(d)
sector A represents = 60˚ ÷ 6˚ = 10 people. So 60 – 10 – 18 – 9 = 23 people
Statistics key concepts
Measures of averages (central tendency): There are three kinds of average in statistics namely mean, mode and median.
Terms to know
Mode: a mode is a number that appears the most or known has a frequent number
Median: is a middle number also know has quartile 2 (Q2)
Mean : is the average of a given group of numbers
How to find mode, median and mean
The following numbers are the grades given to students in a math class
2, 5, 1, 7, 9, 3, 4, 2, 2, 8, 2, 7, 1, 3, 6
a) Find the mode
b) Find the median
c) Find the mean
a) Answer: 2 is the mode
b) To find the median arrange the grades in ascending order
1, 1 , 2, 2, 2, 2 , 3, 3, 4, 5, 6, 7, 7, 8, 9
b) Answer: therefore the median is 3
if the grades after they are arrange is has shown below
1, 1 , 2, 2, 2, 2 , 3, 3, 4, 5, 7, 7, 8, 9
To find the median if the two numbers are in the middle those numbers should be added and then divide by 2
Median=
=
Median is 3
c)
Mean =
Mean =
Answer: mean = 4.133
How to solve a cumulative frequency
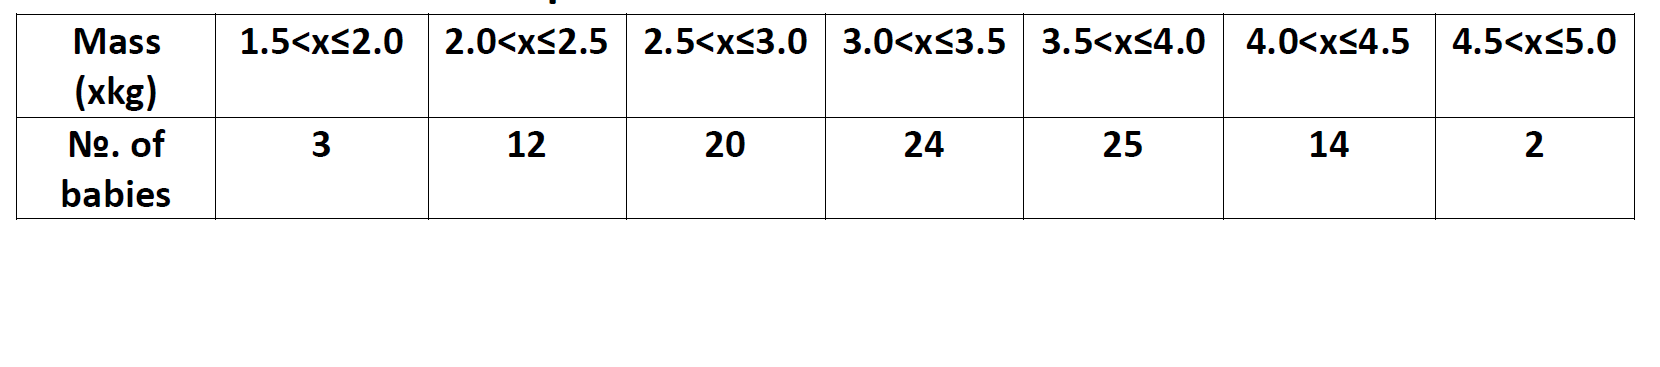
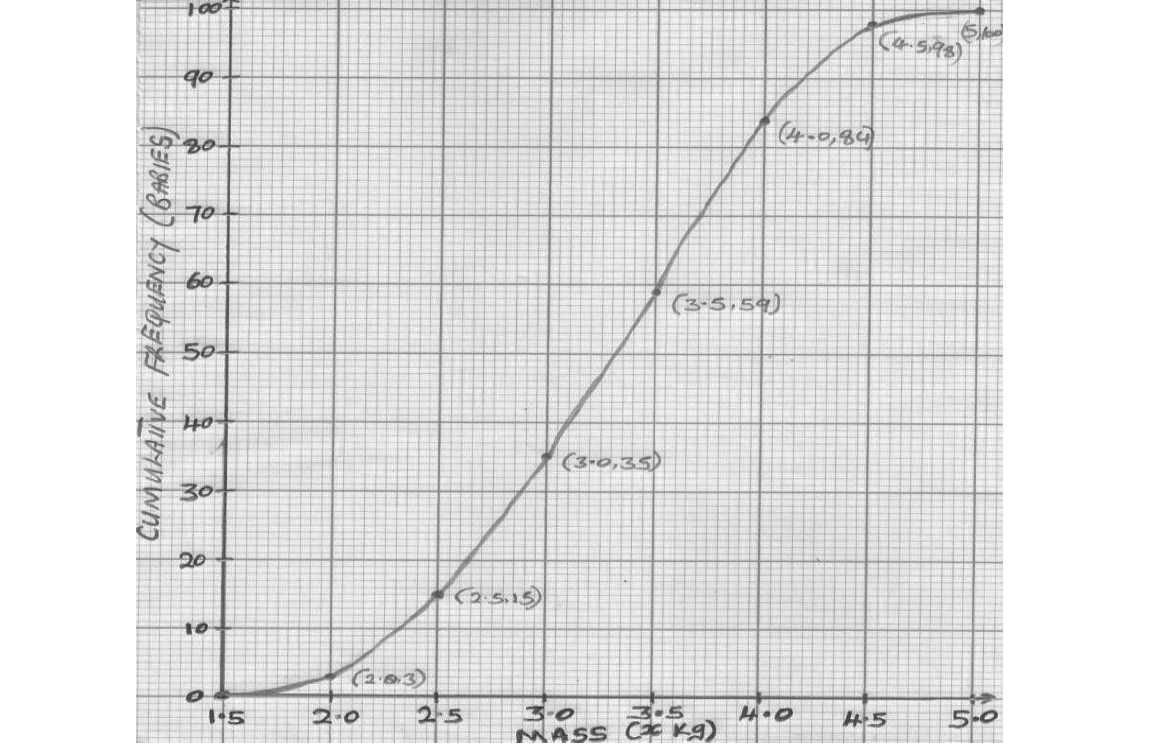
Answer the whole of this question on a sheet of graph paper. The table below shows the masses of 100 babies at birth, recorded at a hospital
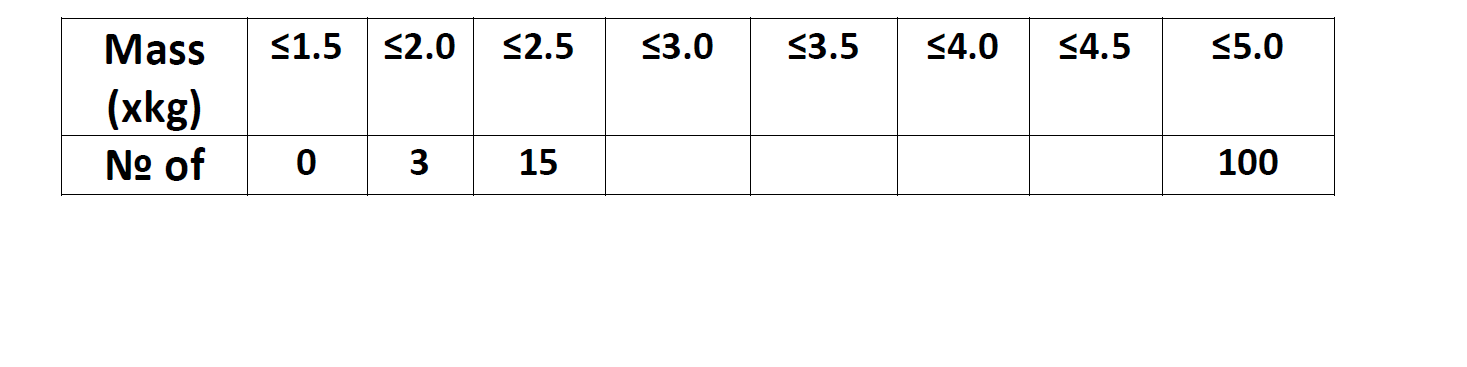
(a) Copy and complete the cumulative frequency table below;
(b) Using a horizontal scale of 2cm to represent 0.5kg for masses from 1.5kg to 5.0kg and a vertical scale of 2cm to represent 10 babies, draw a smooth cumulative frequency curve.
(c) Showing your method clearly, use you graph to estimate.
(i) The median mass
(ii) The interquartile range
(iii) The 40th percentile
(d) How many babies weighed more than 4.3kg?
Solutions
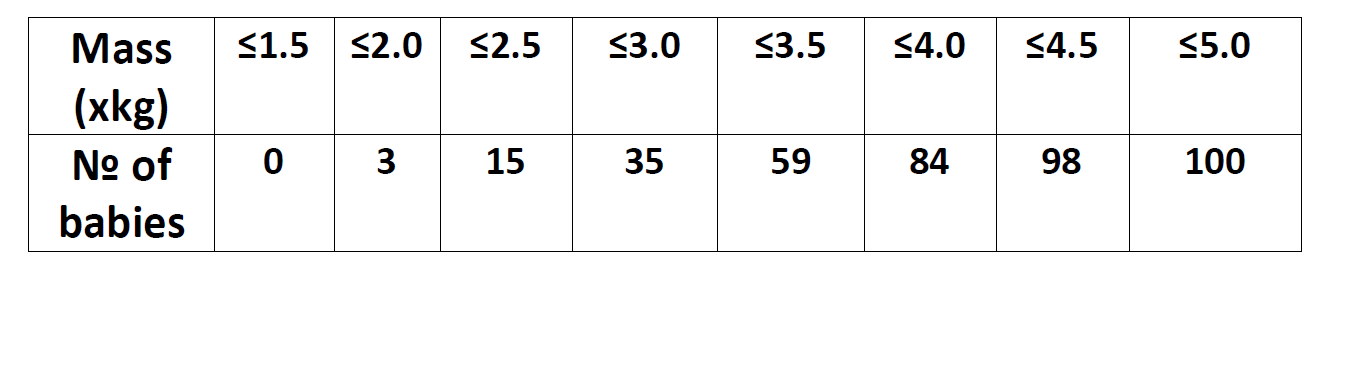
(a)
(b)
Co-ordinates = (1.5, 0), (2.0, 3), (2.5, 15), (3, 25), (3.5, 59), (4.0, 84), (4.5, 98), (5.0, 100)
(c)
(i)
To find the median mass you consider half of the total cumulative frequency. The total is 100 so . Draw a dotted line from 50 to the curve, when it reaches the curve drop it down and pick the value on the mass line.
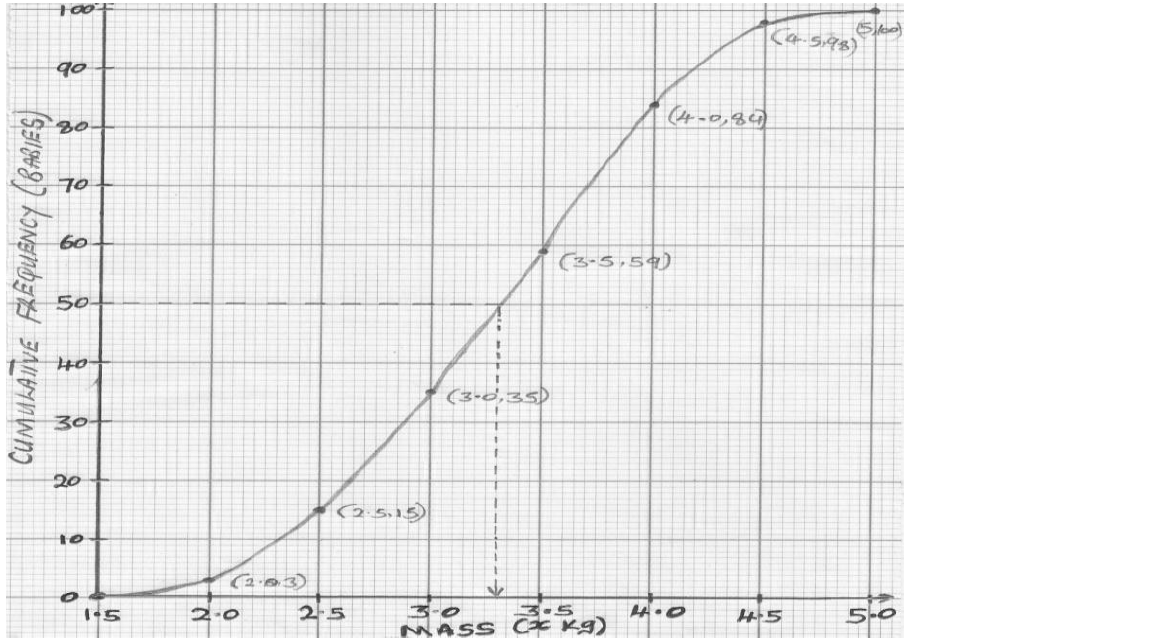
Answer: Median = 3.3kg
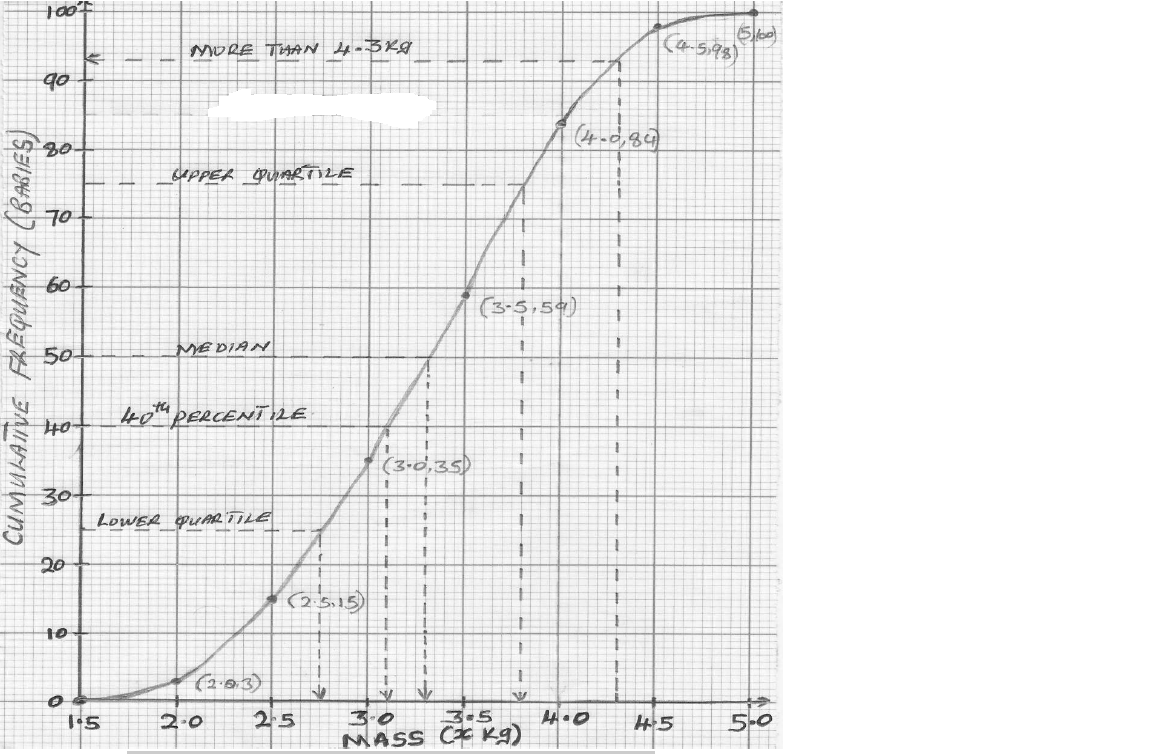
(ii)
To find the interquartile range, you first find the lower quartile and upper quartile then subtract the lower from the upper.
To find the lower quartile mass you consider quarter of the total cumulative frequency. The total is 100 so lower quartile is 25% which is
To find the upper quartile mass you consider three quarter of the total cumulative frequency. The total is 100 so upper quartile is 75% which is
Plot lower and upper quartile
How to find Interquartile range
lower quartile = 2.75kg
upper quartile = 3.8kg
Interquartile = upper quartile - lower quartile
Interquartile = 3.8 - 2.75
Answer: Interquartile = 1.05kg
(iii)
To find 40th percentile draw a dotted line from 40% of the total cumulative frequency, drop it when it reaches the curve and pick the value from the mass line.
From the diagram above 40th percentile = 3.1kg
(d)
To find the number of babies who weighed more than 4.3kg, draw a dotted line from 4.3kg to the curve, then bend to the left and pick the value on the cumulative frequency line to be subtracted from the total frequency.
The dotted line reaches 93, to find the number of babies weighing more than 4.3kg. Subtract 93 from 100
More than 4.3 = 100 - 93
Answer: More than 4.3 = 7 babies
How to find Standard deviation
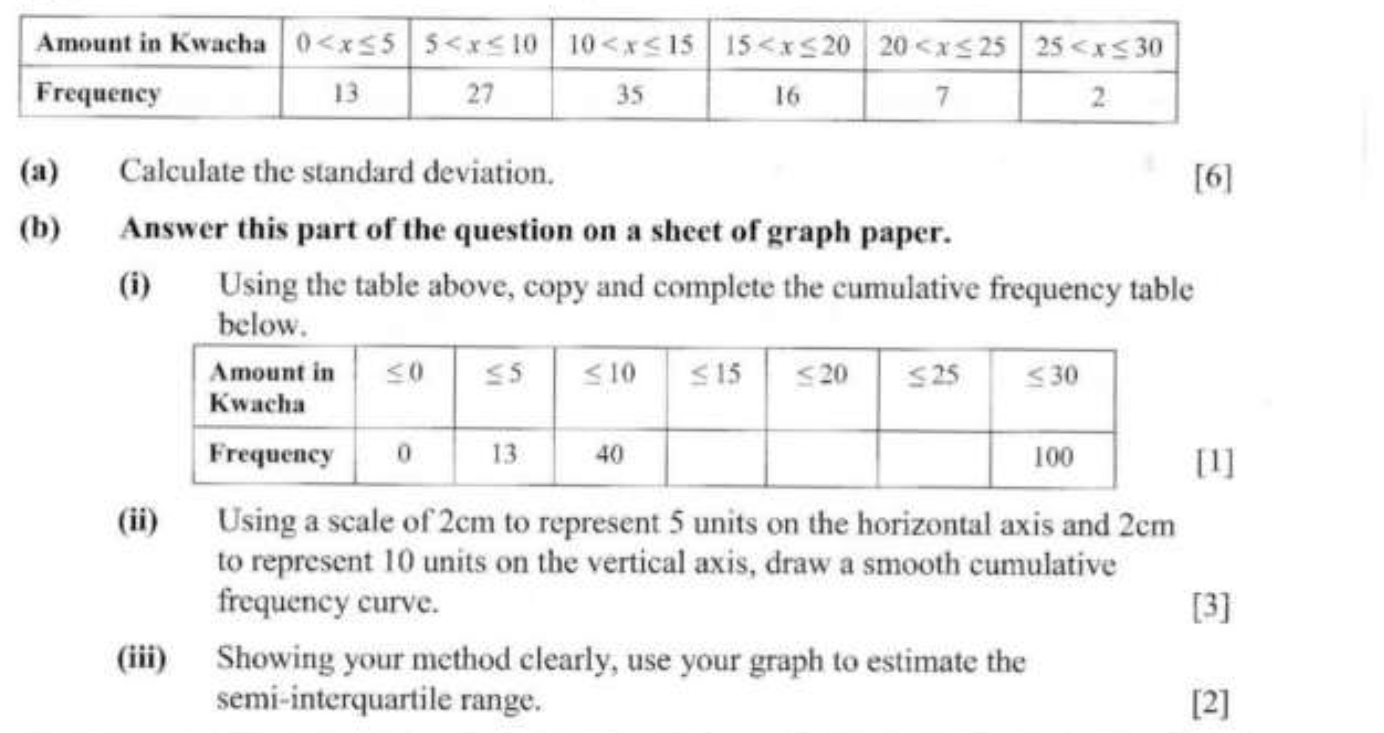
The table below shows the amount of money spent by 100 learner at a school on a particular day.
Solution:
a) Standard deviation
Formula
S.D =
Find the mean
Mean:
From the table above find the middle point of each amount which will muiltiply its respective frequency
S.D =
S.D =
S.D =
Standard deviation = 5.88
b)
(i)
(ii)
(iii)
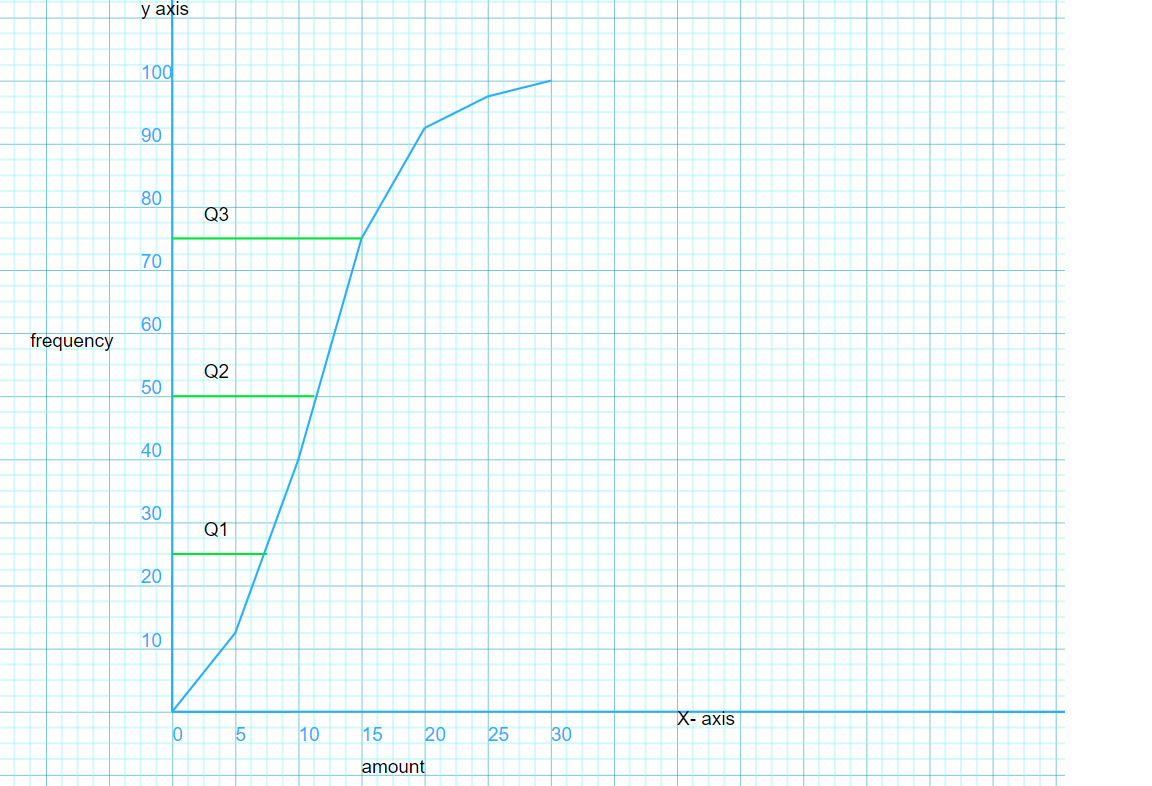
How to find Semi-interquartile range
Interquartile range = Q3 - Q1
Therefore to find the semi-interquartile range divide 2 into interquartile range because semi means half
Q3 = 15, Q1 = 7
Interquartile range = 15 - 7
Interquartile range = 8
Therefore the semi-Interquartile = 8/2
Answer: 4