Flow Chart
A flowchart refers to the diagram that represent a process flow that enables in making decision making easy
« Previous Next »Flowchart Diagram representation
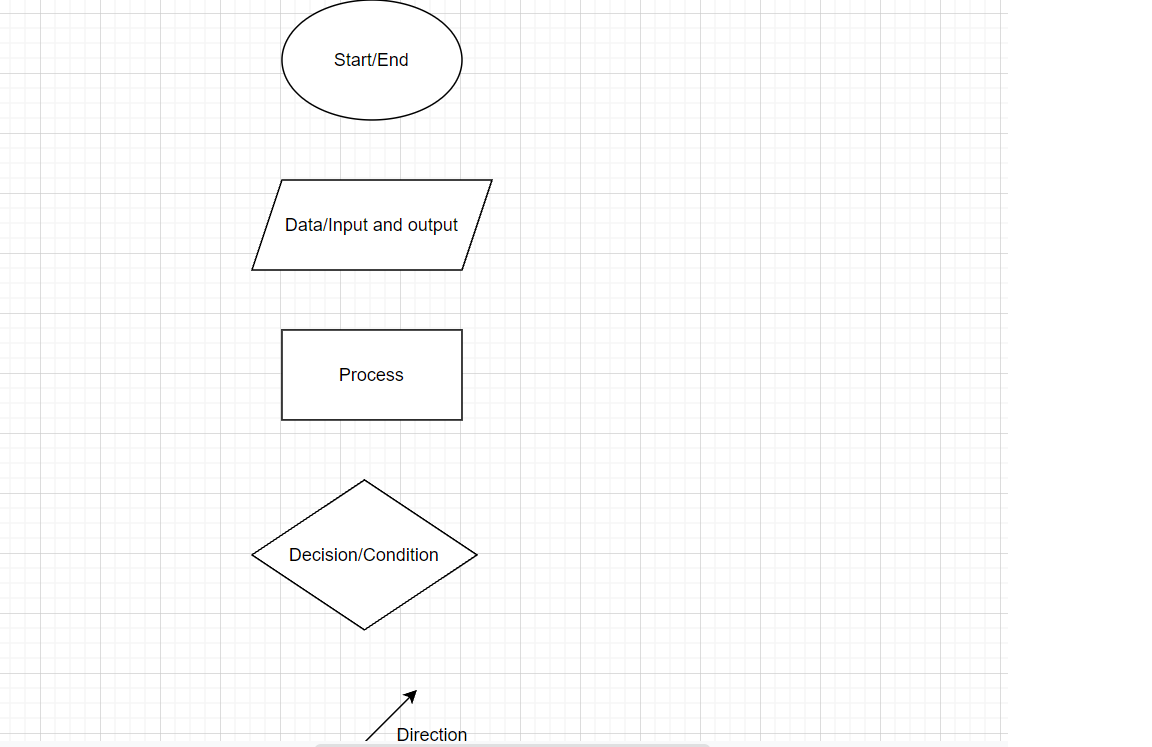
The following are the meaning of the diagrams to put at the back of you head when coming up with a flowchart
Example 1
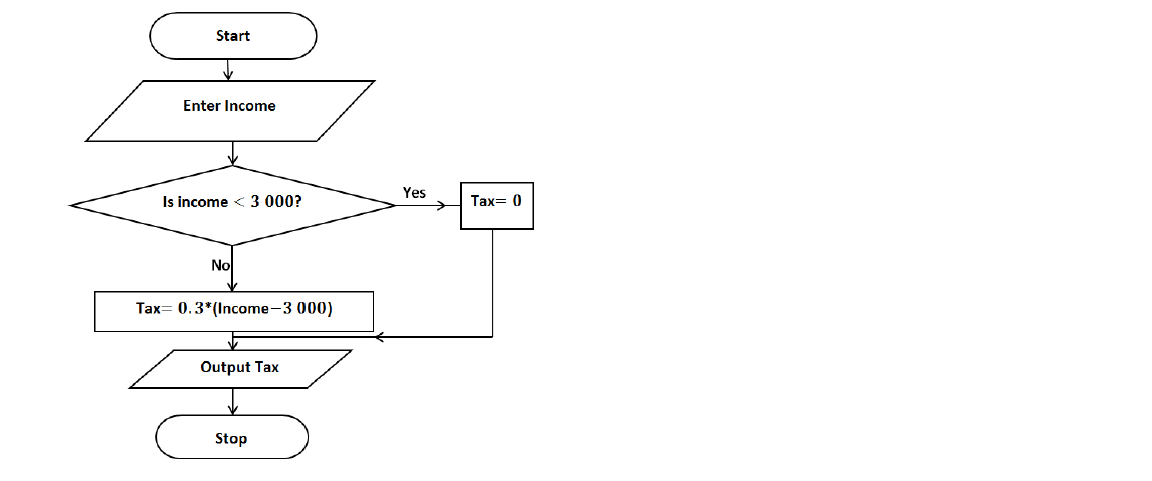
The diagram below shows a flow chart for a program to calculate tax on an income.
Complete the below
Solutions
In box 1 you’re just starting the program
In box 2 you enter the income then the program will do the calculation of tax
In box 2 the suggestion will be made by the program, If income is less than 3 000, the program will use the arrow where it says yes, tax will be zero and will be displayed in the Output Tax box.
Use the first income , is it less than 3 000?
Yes so the calculation will follow the yes route and tax will be zero
Use the second income 5000 is it less than 3 000?
No so the calculation will follow the No route and tax will be calculated as follows
Substitute into the formula, income = 5000.
Therefore below is the Completed diagram
Example 2
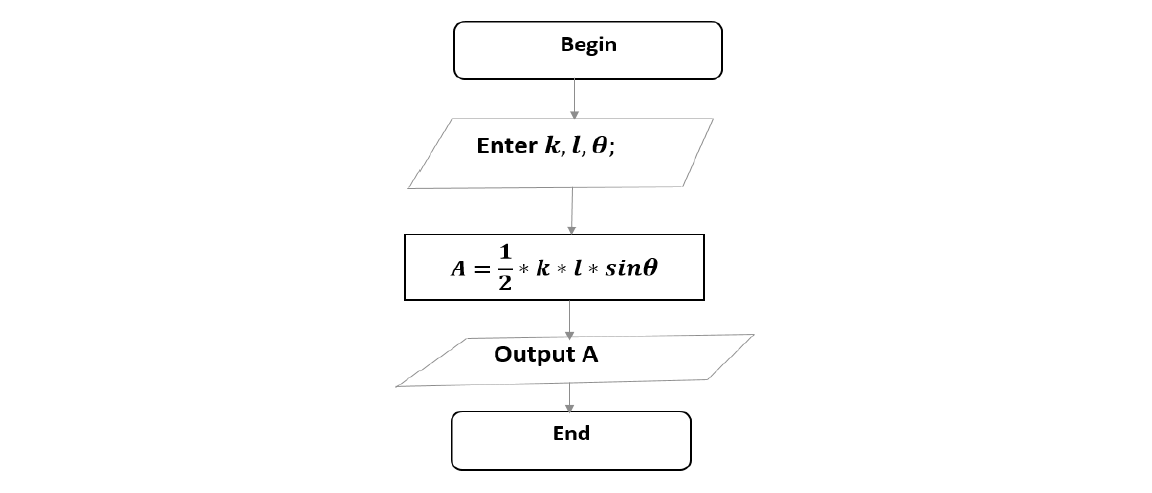
The diagram below is an incomplete program flow chart to calculate the area, A, of the triangle below

Complete the flow chart below by writing appropriate statements in the blank symbols
Solutions
determine the formula to use for finding the area of a triangle. You have two sides k and ladjacent (attached) to the angle .
Use trigonometry formula
so when the computer program begin, you have to feed it with the values of k, l and and as indicated in the follow chart.
Enter the formula In programming use * in place of . So the answer will be;
Draw flowchart from pseudocode
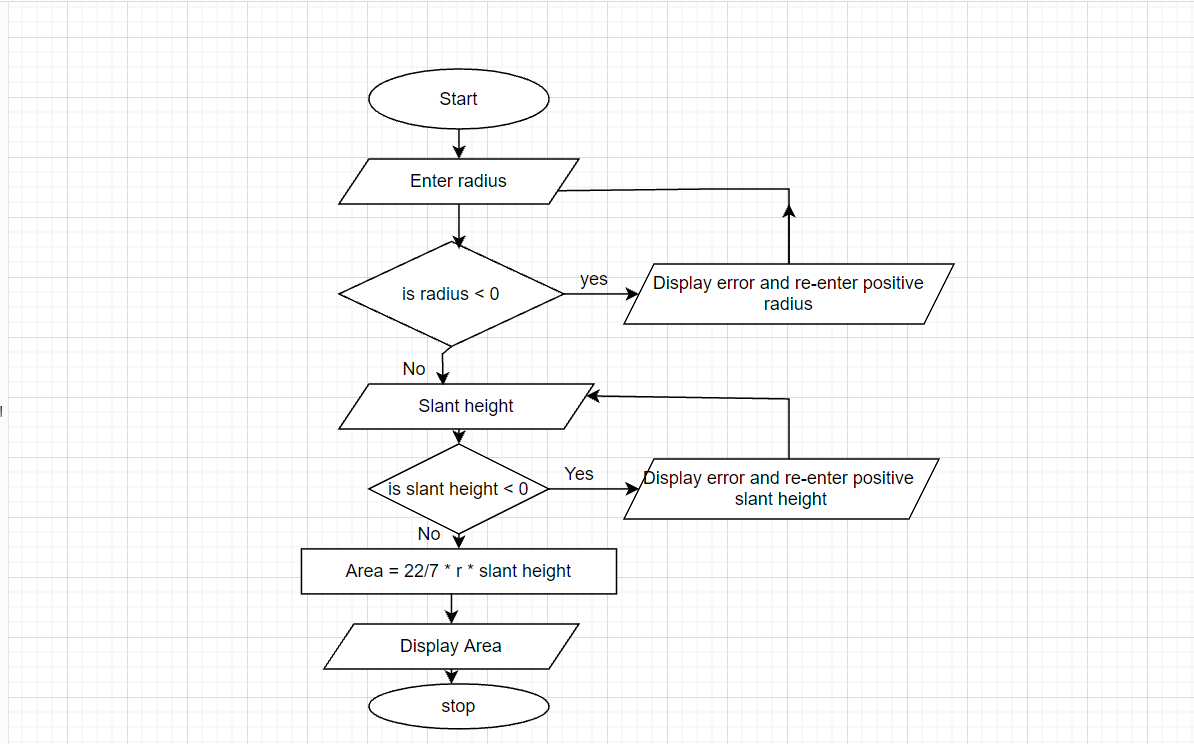
The programme below is given in form of a pseudocode.
Start
Enter Radius
If Radius < 0
Then display "error message" and re-enter positive radius
Else enter slant height
If slant height < 0
Then display "error message" and re-enter positive slant height
Else Area =
End if
Display Area
Stop
Draw the corresponding flowchart for the information given below
Solution:
Write pseudocode from flowchart
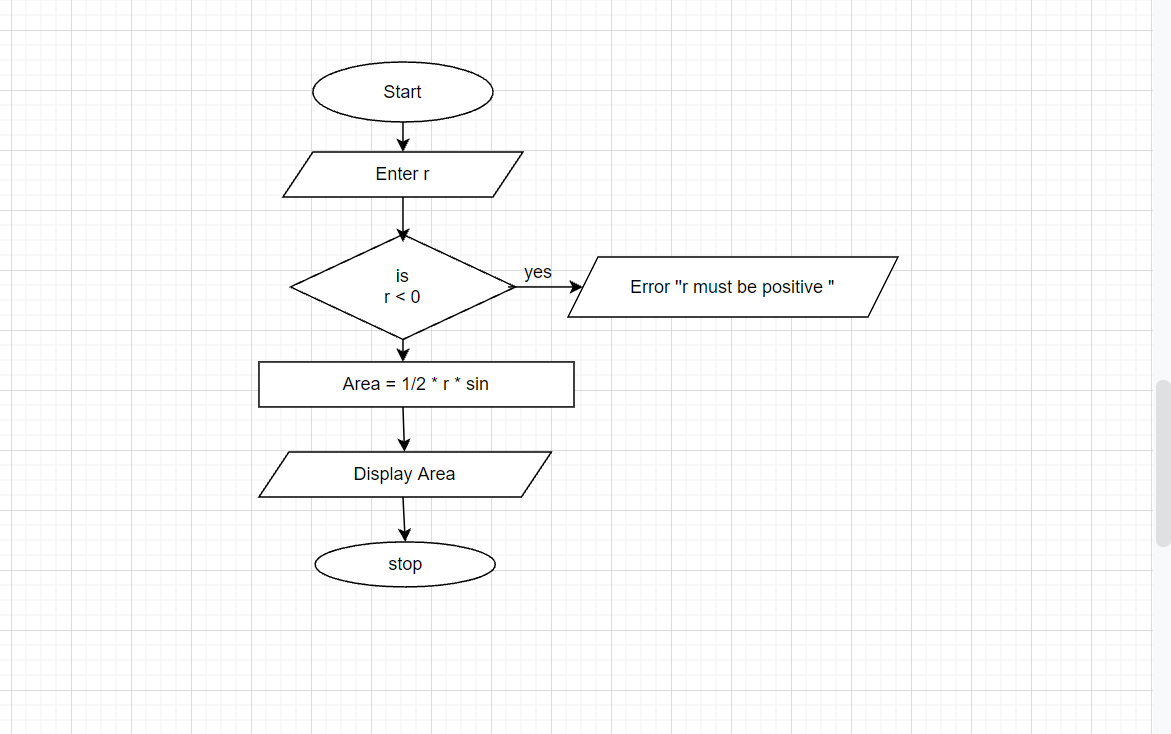
Solution:
pseudocode
start
Enter r
if r < 0 , display error and enter positive r
if r > 0 then
let Area = 1/2 * square radius * sin
Then display Area andStop the program
Flow Chart for Beginners PDF
Are you new to flow charts, pseudocode, and algorithms? If you're looking to understand these fundamental concepts used in programming and problem-solving, you've come to the right place. Our comprehensive guide is designed specifically for beginners, providing a step-by-step explanation of flow charts, pseudocode, and algorithms. To help you get started quickly, we're offering a PDF download of this guide. Download it now to gain a solid foundation in flow charts and enhance your problem-solving skills.
ECZ Flow Chart pdf